Clock time has been a critical dimension for representing human behavior. This has included chronometric analysis using reaction time as a cue for inferring the nature of internal information processing activities and plots of time histories to visualize patterns of activity in time. However, there are other ways to visualize systems dynamics that are less dependent on clock time as an explicit dimension. The construct of field is one important way to visualize dynamical constraints that exist over time (and space), rather than in time. Feynmann (1963) describes the field construct:
It would be trivial, just another way of writing the same thing, if the laws of force were simple, but the laws of force are so complicated that it turns out that fields have a reality that is almost independent of the objects which create them. One can do something like shake a charge and produce an effect, a field, at a distance; if one then stops moving the charge, the field keeps track of all the past, because the interaction between the particles is not instantaneous. It is desirable to have some way to remember what happened previously. If the force upon some charge depends upon where another charge was yesterday, which it does, then we need machinery to keep track of what went on yesterday, and that is the character of a field. So when the forces get more complicated, the field becomes more and more real, and this technique becomes less and less of an artificial separation.
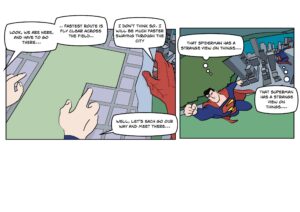
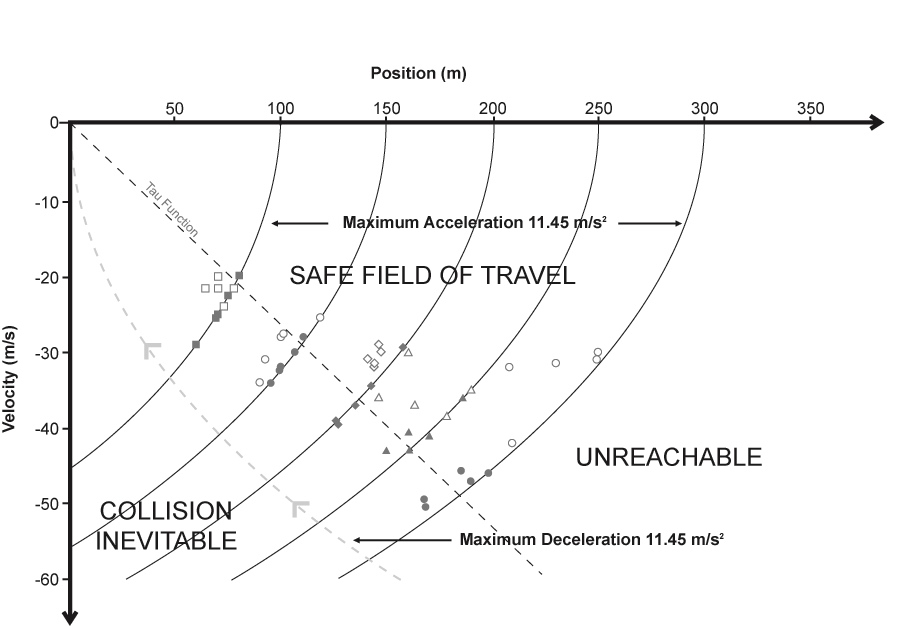
Inspired by Gibson's construct of the Field of Safe Travel, we used a state space to represent constraints associated with a desk top driving simulation in what engineers refer to as a state space diagram. In this representation we plot the constraints associated with maximal acceleration and maximal braking as critical landmarks for understanding driver performance. The points indicate where braking was initiated, the open symbols represent performance early in training and the solid symbols represent performance after practicing. Many have described these types of results as if the driver had learned to perceive Time to Contact, however, we prefer to describe the results as evidence that the driver has learned the constraints of his vehicle and has discovered an optimal, bang-bang solution to the task of approaching and stopping before an obstacle as fast as possible. That is, full acceleration till they reach a point where full braking will stop them before reaching the obstacle. In essence, the driver has learned the dynamics of the simulation. Note this was a table top simulation - so there were no impact of g forces. The point is that the state space represents the constraints over time (i.e., the field; the unique action constraints on Superman and Spiderman) in ways that time histories do not.

Another way to represent patterns over time, rather than instances in time is to use Fourier Analysis. This is a means of representing events as a collection of sinusoidal patterns rather than a collection of points in time. The frequency domain representations allow dynamical systems to be described as observers or control systems that are tuned to certain patterns (e.g., frequencies). This is consistent with E.J. Gibson's theory of perceptual attunement. The basic idea is that with experience, people learn to detect patterns (or structure) in events and that they can use those patterns to anticipate the future and to synchronize their activities with the patterns in constructive ways.


So, while time histories and chronometric analysis of human behavior can lead to important insights into human performance, it is important for social scientists to consider other ways to visualize the dynamics of behavior. The exclusive use of the clock tends to suggest a causal narrative. Whereas, other narratives (tuning to constraints or to patterns) are suggested by alternative representations.
Each perspective provides unique insights and suggests different metaphors, and no perspective captures the complete story.
